Field report E-45 / J5 · sheet /macro
Boardroom MacroFiled from the territory
Oil above $100 is a risk signal, not a reliable stock sell trigger
Stocks fell in 46.7% of months after $100-plus WTI, versus 35.5% otherwise. A 30-month sample supports watching the risk, not treating oil as a sell trigger.
- Grid
- E-45 / J5
- Surveyed
- November 16, 2026
- Reading
- 4 min read
- Correspondent
- Olivia Hart
Field notes
- The study covered 489 months from January 1986 through September 2026.
- WTI closed at $100 or more in 30 months across eight separate runs.
- The S&P 500 fell after 14 of 30 $100-plus oil months, or 46.7%, versus 35.5% after other months.
- The typical following-month return was +0.31% after $100-plus oil months, compared with +1.31% otherwise.
- Of 10,000 random 30-month draws, 1,521 produced at least 14 falls, and the result missed the pre-set bar.
By Olivia Hart
Stocks fell in the month after 46.7% of $100-plus WTI crude months, but the evidence supports watching that risk, not selling because of it. The finding covers 489 months through September 2026 and misses the study's pre-set threshold for separating the pattern from chance.
What does the study actually measure?
The analysis paired monthly West Texas Intermediate crude, identified in the St. Louis Fed's FRED database as DCOILWTICO, with the S&P 500's monthly close, shown as SP:SPX. It covered every month from January 1986 through September 2026, producing 489 observations. WTI closed at $100 or more in 30 of those months, grouped into eight separate runs.
SignalPilotLabs set two tests and the pass threshold before matching any individual month. The first asked whether the S&P 500 fell during the $100-plus oil month; the second asked whether it fell the following month.
The test compared each result with all months outside that group. FRED's October WTI value was $103.37, putting crude back above the threshold.
What does $100 oil change for stock investors?
The S&P 500 fell in 14 of 30 months following a $100-plus WTI month, a 46.7% rate, compared with 35.5% after every other month. In the $100-plus month itself, the index fell 43.3% of the time, against 35.5% elsewhere. The typical following-month return was +0.31% after the threshold was breached, compared with +1.31% after other months.
For practitioners, those figures establish a warning signal, not a trading rule. Oil above $100 coincided with more frequent equity declines and a weaker typical follow-through period. The study does not show that high oil caused either outcome, and the modest one-percentage-point gap in typical returns still allowed sharp rebounds.
SignalPilotLabs summarized the result: "A lean, not a rule." Its practical instruction was equally direct: "Treat it as a lean to watch, not a reason to sell."
Could the pattern be luck?
The direction held in both halves of the sample. Through 2010, the S&P 500 fell 62.5% after $100-plus oil months, compared with 36.3% after other months. After 2010, those rates were 40.9% and 34.1%, respectively.
The evidence remains thin because the threshold produced only 30 months across eight runs. The test drew 30 months at random 10,000 times; 1,521 draws produced at least 14 falls. That result missed the bar set before the pairing, so the study cannot separate the observed lean from chance at the pre-set standard.
Which episodes matter most?
Oil sat above $100 for eight months in 2008, five in 2014 and five in 2022. In 2026, it closed at $102.86 in March and $108.64 in April. The S&P 500 fell 5.09% in March, then gained 10.42% in April.
The latest pair shows why the threshold cannot stand alone as a monthly signal. One high-oil month accompanied a decline; the next accompanied a double-digit gain. That sequence fits the wider finding of weaker typical follow-through without establishing a dependable direction.
How does the chart frame the record?
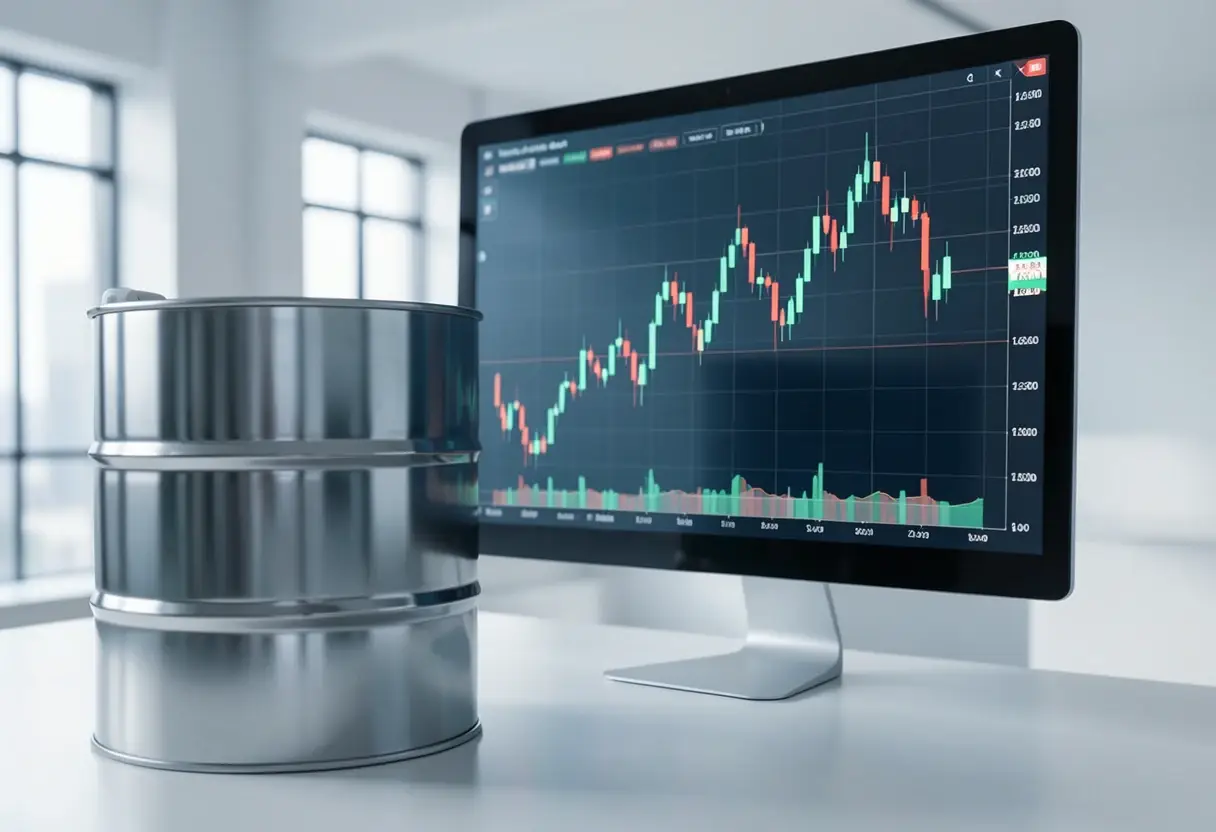
The chart plots monthly S&P 500 performance from January 2007 through December 2015 on a log scale, where equal vertical steps represent equal percentage moves. Shaded areas identify each run of months when WTI closed at $100 or more. Orange marks a falling S&P month, while grey marks a rising month; 10 of the 23 displayed months are orange.
The first version covered 2007 through 2026, but its 238 monthly candles proved too thin to read. SignalPilotLabs then shortened the display to 2007-2015 for visual clarity. The author made that change after completing the statistical test and says it affected the picture only, not the sample or conclusion.
What should investors do with the signal?
The defensible use is as a watchpoint within the monthly risk review, not as an automatic sell signal. Investors can note that equity declines followed $100-plus oil months more often, while retaining the base rate for all other months. Neither step requires a causal claim about oil.
The author also described the work as observations rather than recommendations. That distinction matters for portfolio decisions because a historical association can inform monitoring without validating a trade on its own.
What does the study not establish?
The analysis does not explain why oil reached $100; 2008, 2014 and 2022 were very different years. It does not test other oil-price levels or other equity markets. Its evidence consists of monthly closes drawn from the past, not a forward-looking forecast, and it does not establish causation.
The narrow conclusion is therefore: $100 oil has accompanied weaker stock months more often than not, but 30 observations across eight runs cannot establish a repeatable rule. Investors should treat the threshold as a risk prompt and continue judging the evidence before changing exposure.
via tradingview.com (Source)
More from Olivia Hart
Show full bio
News editor covering regulation, policy and their impact on corporate strategy and chief-executive leadership at CEO Frontier.
458 articles
Adjacent sheets
- Oil surges 10%; airline stocks fell in 25 of 38 such months
- WTI Cracks $81.97 Floor After 16% Slide in 20 Sessions
- Brent Oil Falls 2.65% to $97.65 as Annual Gain Holds at 52.22%
- Brent crude falls 2.5%, undercuts 89.15 floor with 86.29 next
- Brent Crude Slips Below $90 for First Time Since August as Traders Price Peace